
Cold-climate field operations
Elevated platforms, winter kits, additional heating and lens monitoring are selected for the site. Off-grid power and winter access are included in the operations plan.
From the first measurement campaign to wind analysis, layout planning and operational reviews.
Wind maps help identify candidate sites, but local terrain can produce substantial differences at the intended measurement location. Short-term LiDAR adds site measurements between map screening and investment in a mast-based campaign.
Commit to the full measurement infrastructure before confirming local wind conditions.
Use early site evidence to guide full-campaign investment and candidate-site priorities.
Measurements at a lower mast height do not, by themselves, establish the wind speed at hub height. LiDAR measures at multiple heights, including hub height and up to 200m, depending on the configuration and measurement conditions. This reduces reliance on vertical extrapolation alone.

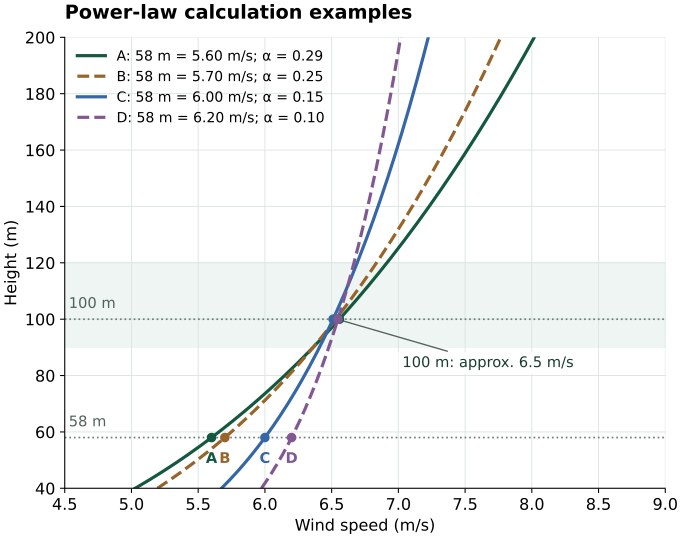
In these power-law examples, wind speeds of 5.60–6.20m/s at 58m all become approximately 6.5m/s at 100m when different shear exponents are applied.
Actual profiles may depart from a single power law. Multiple-height measurements help identify changes in the profile, wind potential aloft and issues requiring further investigation. Larger shear is not automatically better: excessive shear and local terrain or tree effects also need evaluation.
These curves are illustrative calculations, not measured data. The small differences at 100m do not establish a site ranking or an energy yield difference.
We assess the relationship between approximately three months of LiDAR measurements and concurrent reference data such as MSM or ERA5. Where suitable, MCP (Measure–Correlate–Predict) applies that relationship to the nine months preceding the measurements.
The result is a historical dataset ending with the observation period. The estimated and measured periods are identified separately. No additional nine-month observation period is implied; the reconstructed year is also distinguished from a long-term climatological estimate.
We review monthly wind directions and directional energy distributions before choosing the observation window. Sites with clear dominance of the principal energy-bearing wind directions are the primary candidates. Winter measurements are preferred where winter winds dominate; other periods require assessment of seasonal transferability and correlation quality.
Observation timing also depends on access, land use, permissions, power and equipment availability. Poor seasonal coverage or correlation may require a longer campaign or measurements in another season.
This is an early-stage screening service. It does not replace a full-year site measurement campaign or final certification/design assessments. Complex-terrain measurement effects and unobserved seasonal shear remain part of the evaluation.
We plan WINDCUBE campaigns around terrain, snow, power, communications and maintenance conditions, in collaboration with NERI. Measurement locations are reviewed for their relationship to the planned turbine area and local flow influences.
Elevated platforms, winter kits, additional heating and lens monitoring are selected for the site. Off-grid power and winter access are included in the operations plan.
NERI’s square-section masts use four-direction guying to limit horizontal guy-wire distances. We assess installation options for restricted areas and sloping anchor locations. Joint field experience includes helicopter and monorail transport, and communications using high-performance antennas or satellite links.
LiDAR availability = time in normal measurement operation ÷ total observation time × 100.
Reboots and high-/low-temperature protective shutdowns count as non-operating time. The reported calculation excludes lightning-related downtime at one site. Site conditions and observation periods differ.
Valid data recovery is a separate measure: it is the proportion of usable wind data after the specified quality criteria are applied. Aerosol conditions, fog and other measurement factors can affect recovery even while the system is operating.
Data management combines time-series review, measurement-quality checks and explanatory comments. Reports are tailored to installed sensors and the agreed scope.
For co-located mast and LiDAR campaigns, we compare concurrent data at corresponding heights: wind-speed R² and regression slope, wind-direction distributions, overlaid wind roses and normalized shear profiles. Monthly reporting is distinguished from a complete certification-specific correlation assessment.
Nearby meteorological observations can also provide context for monthly wind variations. Original and processed data, exclusions and any gap filling are documented separately.
We combine measurement review with CFD to assess local flow, preliminary energy yield and wind conditions relevant to early turbine selection.
MASCOT is a flow-analysis package developed jointly by the University of Tokyo and Suiki Network. It is used for wind resource and extreme wind speed assessments in Japan’s complex terrain.
We document inputs, assumptions and unresolved issues for developer and turbine-manufacturer discussions. Final certification and design-suitability assessments are coordinated with the responsible specialist consultants and manufacturers.
We review measurement locations for representativeness, local terrain effects and later use in assessment. Turbine layouts bring together energy yield, wakes, extreme wind conditions, shear, turbulence and civil-development constraints. We support technical discussions among developers, civil teams and turbine manufacturers, with experience on layouts that have progressed to construction.
We support owners after commissioning by examining the relationship between wind conditions and generation, comparisons with turbine power curves, and the effects of stops and error events. Findings support discussions with the turbine manufacturer and decisions on further investigation.
Our experience includes acquisition reviews of operating wind farms, pre-construction assessments, lender-facing technical reviews and assessments soon after commissioning. The evaluation topics, available evidence and deliverables are agreed for each assignment.
Joint work connects candidate-site information and field investigations with measurement plans, local flow assessment and preliminary turbine layouts. Equipment, access and maintenance conditions are considered alongside the analytical requirements.
NERI’s site-development support (Japanese) ↗For an inquiry, include the location, current project stage, technical issue and the work you are considering commissioning.
Project inquiry details →